Wednesday, August 14, 2013

Bimotics' technology in a B2E scenario

As our product further develops and I get to see how it is turning out, it seems that a another and different competitive advantage is beginning to emerge. One that I was not expecting as we aimed to find solutions for just small business. Perhaps I am influenced by thoughts of pivoting to the B2E space.  Perhaps it is just the journey where you do not always end up where you thought you would.

Observing consultants and IT organizations implement large business intelligence solutions, I find often that the first project either fails entirely or never gets past the initial phases. Lessons learned from these setbacks are often rooted in the client/ business not knowing the data they really want or political battles over which information and metrics are most important. Technical architects have avoided such battles by instead providing data marts, so that managers can help themselves to any data and build metrics in a self-service manner. By giving the client or business everything, the problem is solved.

But does this approach really help the business in the end? My answer is no. Managers remain misaligned- serving their own agendas instead of those of the overall business. Internal to the organization, data proliferation occurs where meanings get blurred and maintenance is so difficult even labels lose their original purpose of a sufficient description. Data silos of big data proportions are saved per division which is wasteful and duplicative.

Generally, I am describing an enterprise problem. Small and medium-sized businesses (SMB) suffer less from these political problems as they cannot afford much system customization and the resources needed to maintain it. Instead the SMBs tend to stick with the standard and best practice fields and data points. Because of this, Bimotics can provide our customers a solution we call the “gallery of analytics”. This gallery hosts all the business analytics available given the operational and financial application data marts for which the customer has data.  Generally, these pre-built analytics reflect best practice operational and sales processes that is fundamental in all business looking to grow. The image below is an example of what the analytics gallery looks like.
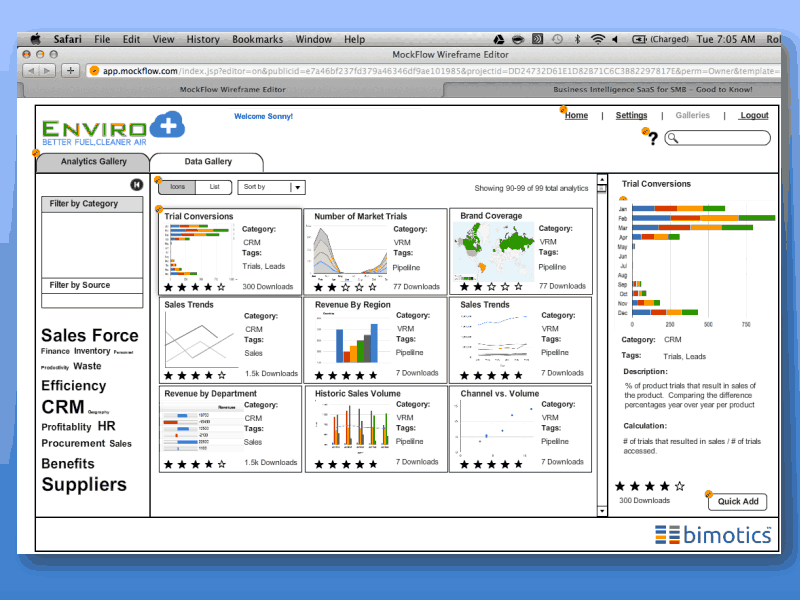
The value to business owners is that they do not need to know what metrics they want before they bring on analytics. Instead they pick and choose the available analytics that which makes sense to answer a particular business problem. They also can prioritize these analytics based on the business strategy they laid out for now.  If the business changes direction, then the business owner can change out the analytics to reflect this new vision. Not having to go back to the drawing board saves precious time. This gallery approach to analytics puts the definition and the prioritization of metrics and at the end as well as provides breadth and flexibility to a manager.  

Can this same principle be applied to solve an enterprise problem? Although very complex to build, can an “analytics mart” based on only the standard fields and best practice processes of major enterprise applications such as SAP, Oracle, Microsoft and SalesForce be built using the similar principles as our “gallery of analytics”? This “analytics mart” would cut across the different vendors so that advanced metrics are available. For example, metrics, like support center effectiveness, are shown as a blend of financials in SAP with support data from Siebel. This proposed approach, solves amongst the greatest barriers that keep enterprises from successfully implementing business intelligence in that it defines what to measure up front and avoids the interdepartmental politics in its allegiance to only standard and best practice processes.

Why companies have not implemented “analytics marts” already? The answer is twofold.  First building an analytic mart across enterprise systems houses many technical complexities especially when looking at all the software versions and system customizations that exist per enterprise. This is not to say that a solution is technically impossible however.  Second, budgets split by division and departments need to be continuously spent in full which enable data silo behavior over cross department collaboration and process analysis. In other words, large organizations have budgetary policies that encourages managers buy solutions while wearing horse blinders.  I wonder how much of a fundamental shift would need to occur in an organization to embrace data and metrics sharing.

The key to customer adoption of the “analytics mart” solution rests on a consolidated drive to improve the overall business and the willingness of  enterprise managers collaborate holistically. Will these managers be courageous enough to be measured against fundamental business process standards in addition to how well their divisions support the corporate strategy at hand?   

Saturday, August 10, 2013

Shark Week and Shark Tanks

Since it is Shark Week, it is only appropriate to dedicate one blog post to my experience pitching Bimotics in a shark tank. Investment groups, entrepreneur clubs and academic programs have all jumped on this trend of hosting business shark tanks. Active entrepreneurs that seek funding from outside investors these days, most likely will find themselves preparing for our actually pitching in a shark tank.

It is especially important that an entrepreneur to have their startup story crisp and solid.  I have found that talking to individual investors will be a be more inquisitive and casual in talking about your business. But in the tank, the story needs to fact based and all the latest numbers and metrics rolling off your tongue.  Although passion for your business is important, there is less time to convey it.

The sharks in the tank may not be evaluating your business under the same criteria.  Some may be looking for early stage, others could be looking for B2Cs, others are looking for that one story that is missing from their portfolio. This makes it hard to because you cannot tailor your message just the one investor or topic of interest. If you have the luxury to know the background of each perspective shark, I’d just tell the story to the very most one you want.

It is rare that your startup will get all the investors to be frenzied over you. The businesses that do are special enough to have their story told on business insider. However, it just takes the one right investor to make it all worth it.   

Happy Shark Week!

Thursday, August 8, 2013

What is in a tagline?

When we first started Bimotics, co-founder and I continuously refined our with the story and sought to find efficient ways to describe our business. We took the approach of talking to as many people as we can. Not just the target customer, but also potential investors and professionals. In all honesty, the task was amongst the most frustrating things we have had to do for Bimotics. To my defence, you try to explain what business intelligence is to a small business owner.  


Last year, I was traveling back from visiting my parents. I stopped at the Barnes & Noble to buy a paperback for my flight. (I generally travel with one tablet reader and one paperback; so that I can continue to read during takeoff and landing.) Since I was in the prime of my frustration, I bought, Words That Work: It's Not What You Say, It's What People Hear by Frank I. Luntz.  It turned out to be an amazing book that i couldn’t put down until arriving back in Miami.


Lunz tells us that a good tagline should be between three and four words. For business, it should conjure a positive emotion and be associated with what one could experience using your product. A good tagline could was also something that you could hear in everyday conversation.  
I sat through the flight listing different possible taglines for Bimotics. I tried lines that would be associated with being enpowered or becoming stronger and smarter. I tried clever and witty lines about digging through and using your data. Then there was an announcement on our flight saying that we were a little delayed a bit and what number our baggage carousel was going to be when we landed. The boy across the aisle me put down his iPad, took off his headset then leaned over to his mom and said, “Good to know.” IT WAS PERFECT!

Good to know is a common expression used when you learned something that will be particularly helpful to you. It is used to communicate appreciation, pleasure or relief about knowing something you previously did not. That is exactly the mission of this startup.  At Bimotics, our metrics, analytics and dashboards will point to revelations about a business’s operational health and financial performance. We want our customers to say “Good to Know!” when they use our software and learn something from their own analytics. Whether it is saving money, going after better markets or laying out a different operational strategy, our products can support these decisions.

Our tagline has been Good to know ever since.

Monday, August 5, 2013

Our marketing campaign: Essential Analytics

Today, I just finished updating our first white paper for BimoticsEssential Analytics campaign. From concept to fruition, this milestone took much more time and effort than I expected- nearly a year. Much time was spent understanding what my potential customers, the small and medium sized business really need to know about analytics.  

After wading through topics about why metrics do not work for small business such as not having the know-how to set up metrics let alone time to look at metrics and having low data quality with the applications.  (Problems our software also solves but makes us sound like IT folks.)  I was wanted to focus on bringing value to those that were already open to metrics and analytics, but needed more practical advice on how to apply it. The response from potential customers that stood out and fit with my goal was: There is not enough context on when it is appropriate to use one metric or KPI.

As a practicing business analyst, gaining insight from the data and measurements comes more naturally.  But observation has shown that many small and medium sized businesses do not have a seasoned business analyst to “read the tea leaves”. Even our early adopters, can struggle with making sense of the numbers. Once an organization has the ability to measure their business operations and performance. Questions immediately arise:
  • Does this metric make sense for my business model?
  • Does this metric make sense for my industry?
  • Which of these metrics are more important?
  • What does the analytics even mean to my business?
  • Do these metrics even align with my current strategy?

From this research, I worked on the design for my for essential analytics marketing campaign. The white paper series will showcase one key business metric that one can get out of our first data sources: Quickbooks and Freshbooks. Then, we use business cases to describe how other managers and business owners use the metric to get solutions to everyday business problems. Our readers can get both more context around metrics and how they can be used, as well as, come up with ideas on how to use analysis to answer their own questions.

Tuesday, July 30, 2013

A design thinking approach: Observe extreme users 2

Continuing the learning from the Design Thinking training, figuring out who will be the extreme users of Bimotics is similar to the hypothesis of our early adopter customers. It is not a stretch to assume that those that are currently measuring and analyzing business would be the the most likely early adopter and positive extreme user.  On the other side of the spectrum, the extreme users that are least likely to use our products are those with either low data quality as poor quality adversely affects the effectiveness of analytics or hidden agendas that is not supported by the data.


The things I would like to observe from our extreme users that love our product and find value in our features include the categories of analytics that mean most to them.  Are they leveraging topics related to sales and marketing over supply chain and finance?  How are they using the customer flows we designed? To navigate to and from analytics and dashboards, are they taking necessary steps to get around? I have learned from other software entrepreneurs that small business “use copy” and paste more often than using “new” in order to avoid typing in the same information over and over. Finally, I would like to know on what devices they access our application. Our product is mobile enabled; and we have taken care to so that our infrastructure supports mobile.  I would like to know if it was worth it.


Something to observe related to the extreme users who don’t use or even dislike our product, it whether or not they go to their teams and applications and work to improve data quality.  Are there initiatives or trainings that makes their resources input better information?  For those whose agendas don’t have data to support their decisions, I would be very interested in seeing and understanding how communication is done to other team members and whether they get push back from the others with access to the same analytics.  

I’m sure there are other groups of extreme users.  And the identification of extreme users can extend past product users.  For example, those that read this blog would be not segmented by product customer.

Friday, July 26, 2013

A design thinking approach: Observe extreme users 1


I was excited for the training I attended this week called Design Thinking.  The trainer, Experience Point, based the whole session on the methodology of IDEO, one of the greatest design firms that have come up with innovative solutions that we use everyday.


A bunch of blogs and startup readings, have been about getting out of the building and talking to customers.  At Bimotics, we have constantly talked with small business owners of all types about our business idea, our tagline, our data sources we want to connect.  Sometimes we got an excited response and sometimes the person simply didn’t get it.  Getting to talk to anyone that will hear us out was always appreciated, but I can’t say the talks were always helpful. There was continued ambiguity on how to put what a business owner was saying in a context that made sense.

In the design thinking training, I learned the concept of observing the extreme users.  Extreme users are those that fall outside of the normal 80% if you are looking at a normal distribution. The extreme user is on both sides of the 80%. The first group represents the users that love and have completely adopted and live the subject you are studying. The other group represents the users that never use or care about the subject.  

Observing these groups is the key to getting real insight. You can see the difference between each extreme user. This can help provide context needed to get more quality insight. Being able to observe the right group requires a bit of profiling and a clear understanding of what you want to learn. Observing is not just having conversations with random users.  It is almost opposite, it is about consciously being objective and simply trying to understand how the user ticks.  When you have a conversation you may instill bias unintentionally.  

Tuesday, July 23, 2013

Sales Representative KPIs

In setting up a performance based sales organization, managers and small business owners can create KPIs for their sales representatives.  KPIs stand for key performance indicators which are measurements a business takes to monitor performance.   According to the KPI Mega Library, there are a few related to the sales representatives:


  • Day-to-day sales activities:
    • # of average appointments per sales representatives
    • Time to answer a request by customer
    • # of customers per sales employee
  • Sales revenue measurements:
    • Average sales revenue per sales person
    • Total costs to gain a new customer
  • Sales team performance:
    • Average sales turnover per sales staff
    • % of sales representative that met or are above quota
    • % of sales representatives that have met sales target
    • Total sales of sales staff / Total customers of each sales staff

It takes continuous measurements of these KPI to understand how well your sales team can performance as well as how much they can improve.  Trending over time, is the easiest way to analyze the performance and changes.